Project Overview
Turning IoT readings into equipment-health signals
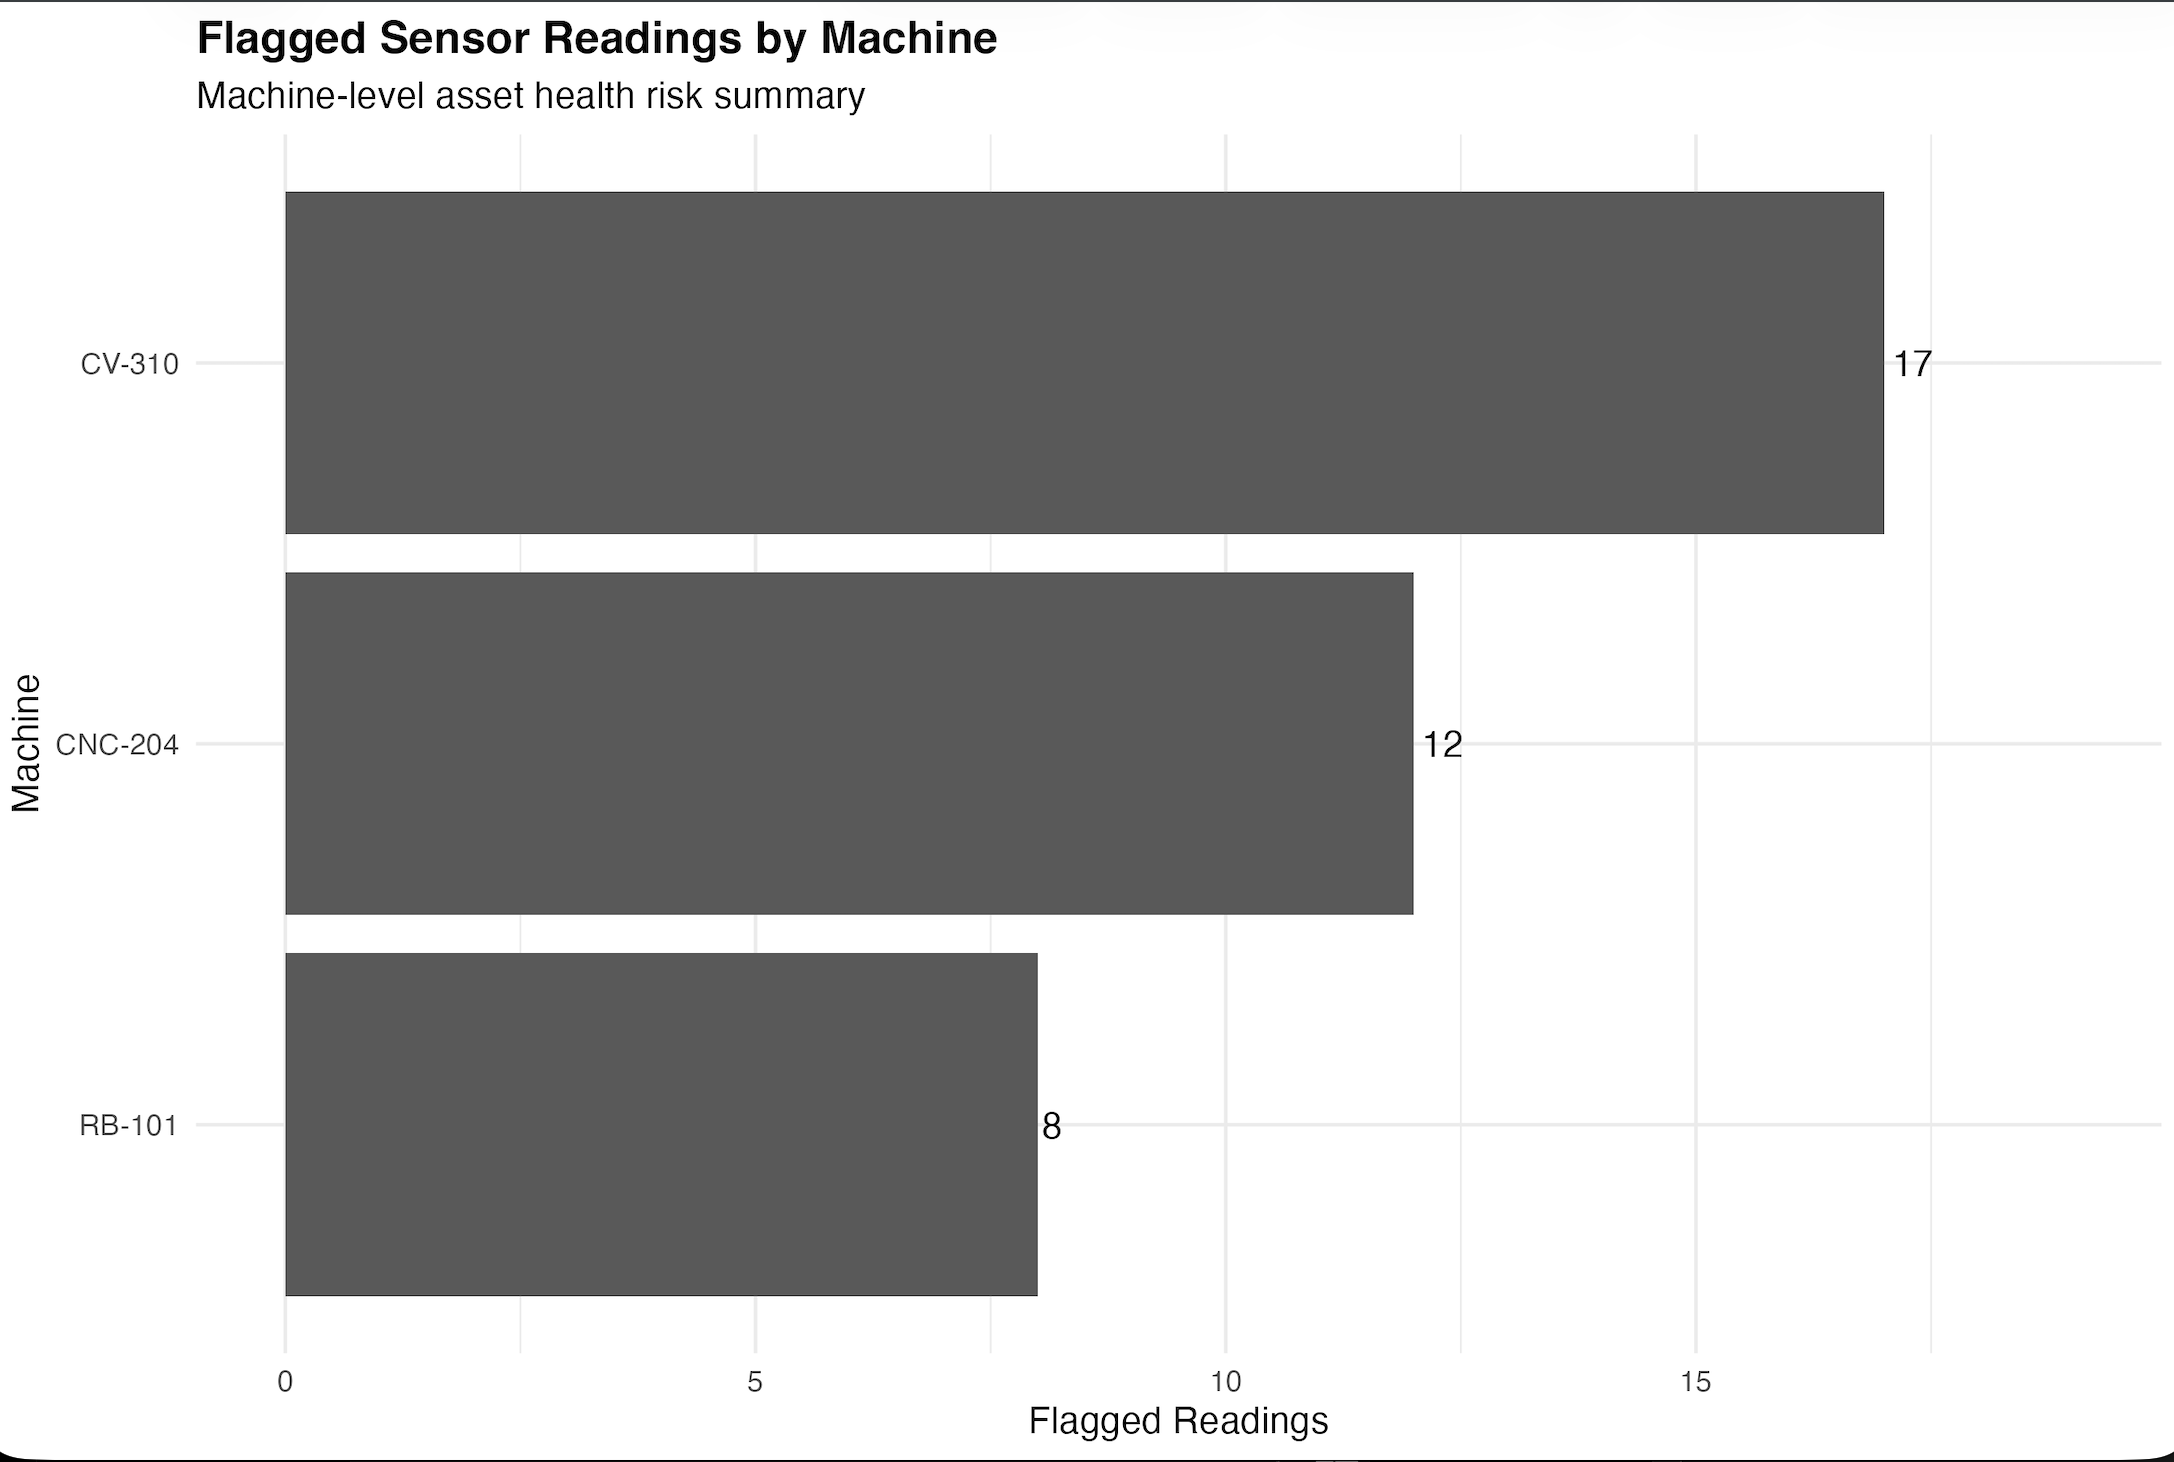
The analysis evaluates temperature, vibration, voltage, and cycle-time readings from robotic arms, CNC machines, and conveyor equipment. PostgreSQL performs rolling-window feature engineering and anomaly detection, while RStudio produces machine-level summaries and visualization outputs.
Database Foundation
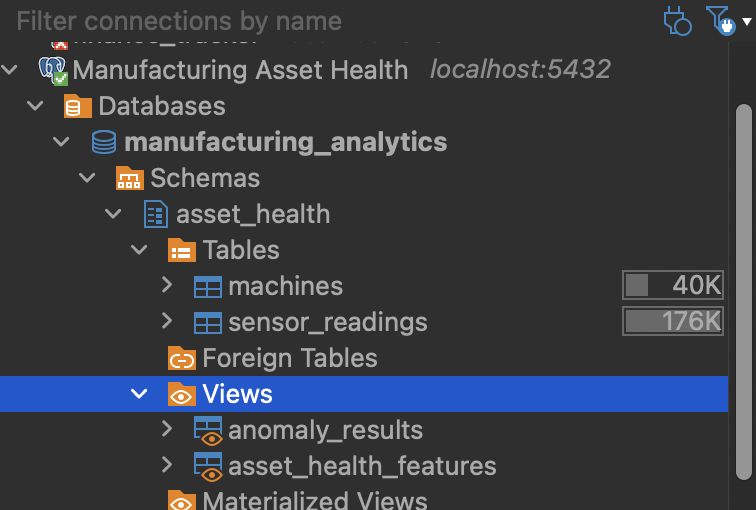
PostgreSQL data model
Time-Series Data
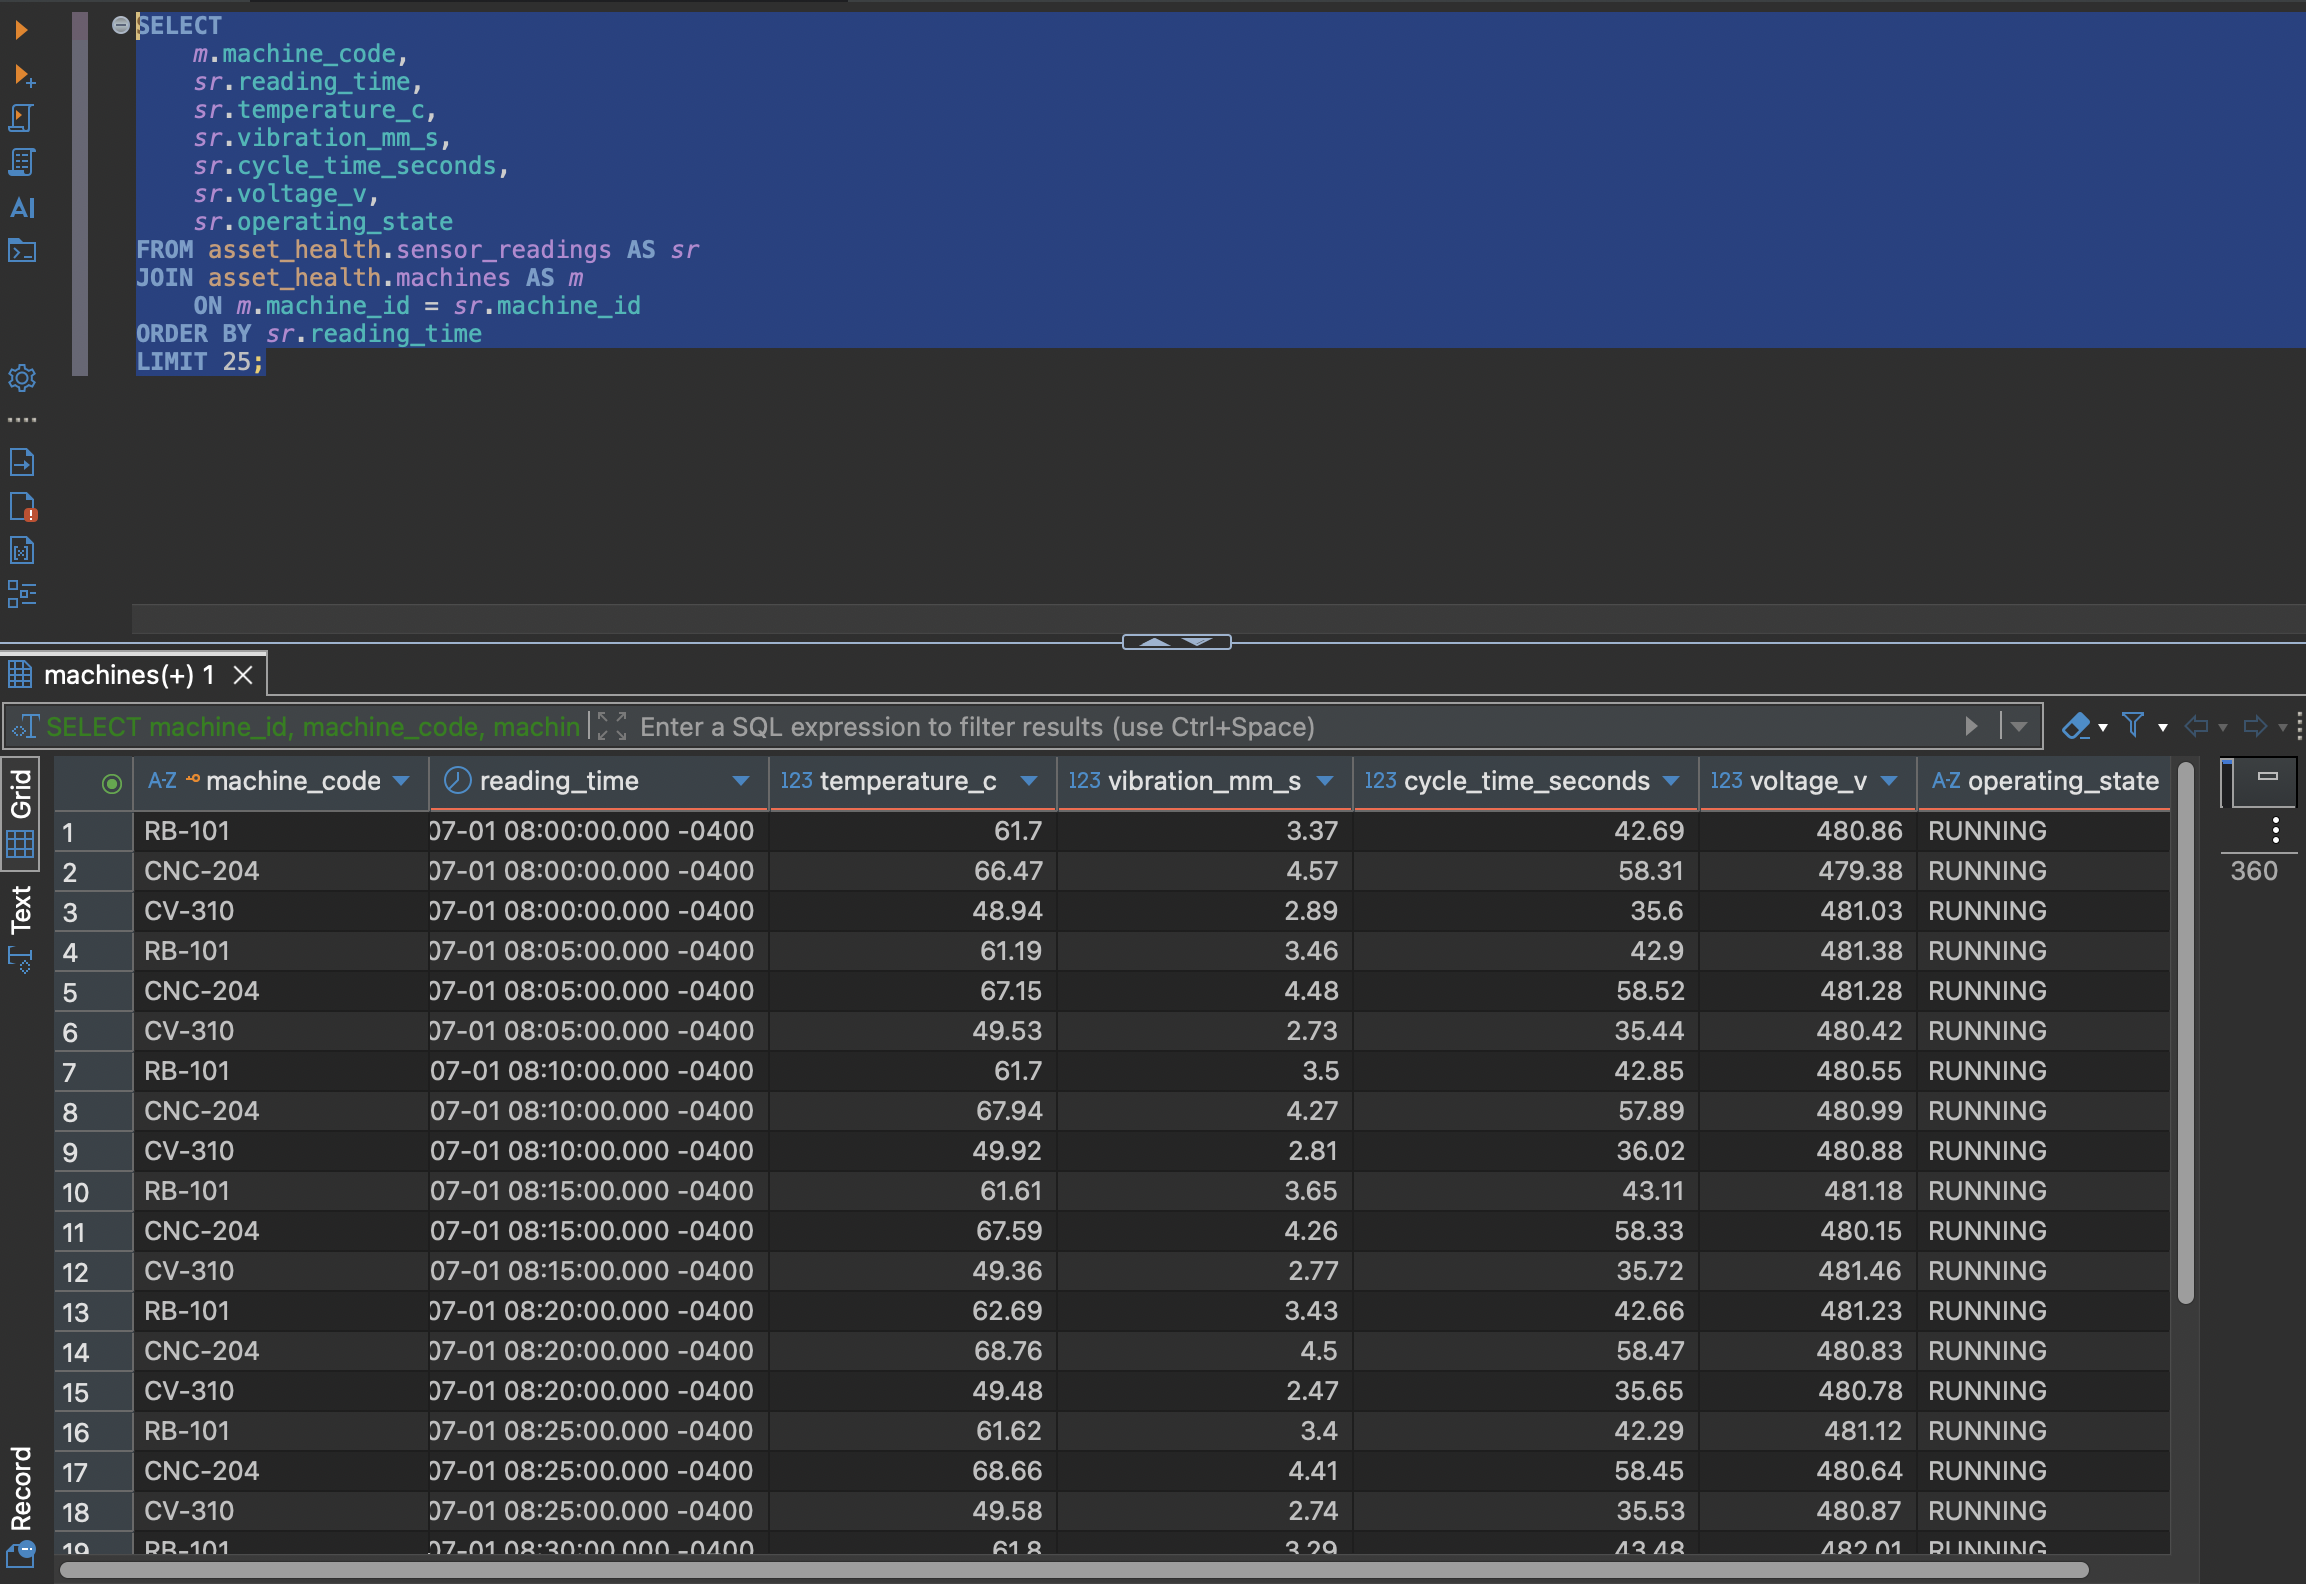
Simulated IoT equipment readings
Anomaly Detection
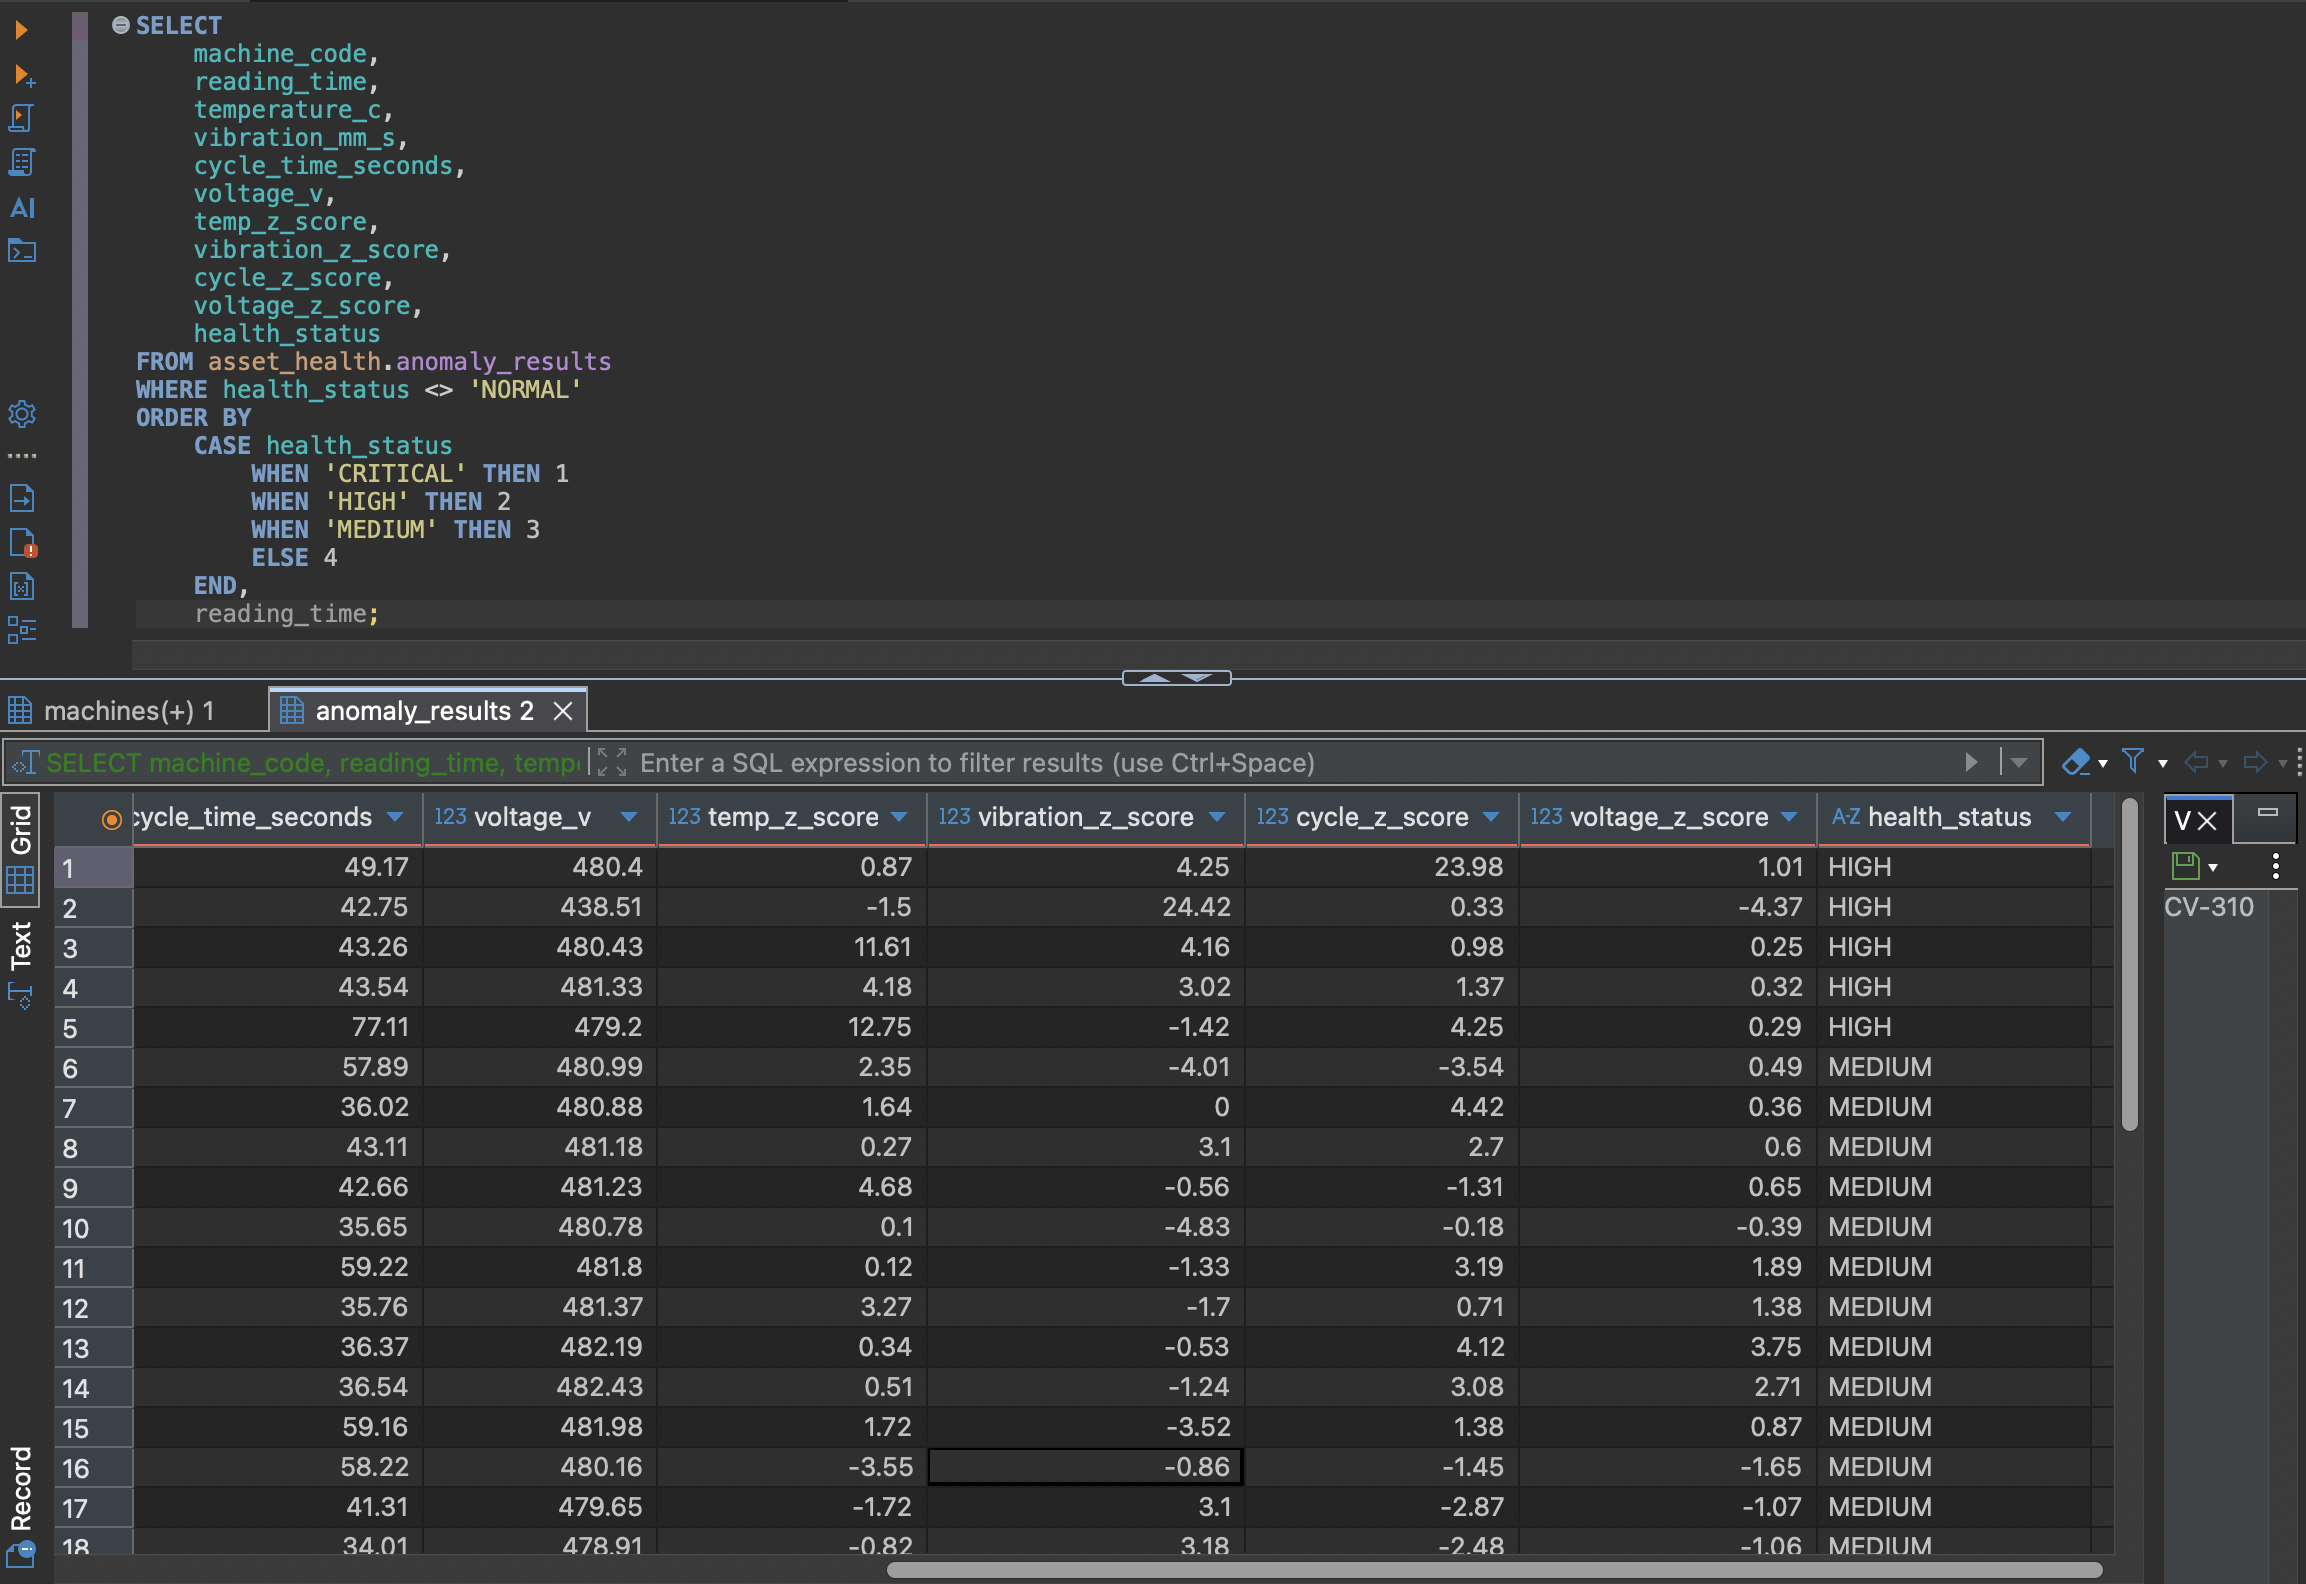
Rolling baselines and z-score alerts
Each reading is compared with the machine's previous operating window. Temperature, vibration, cycle time, and voltage deviations are converted into standardized scores and assigned a health severity.
Root Cause Preprocessing
Sequential event dependency
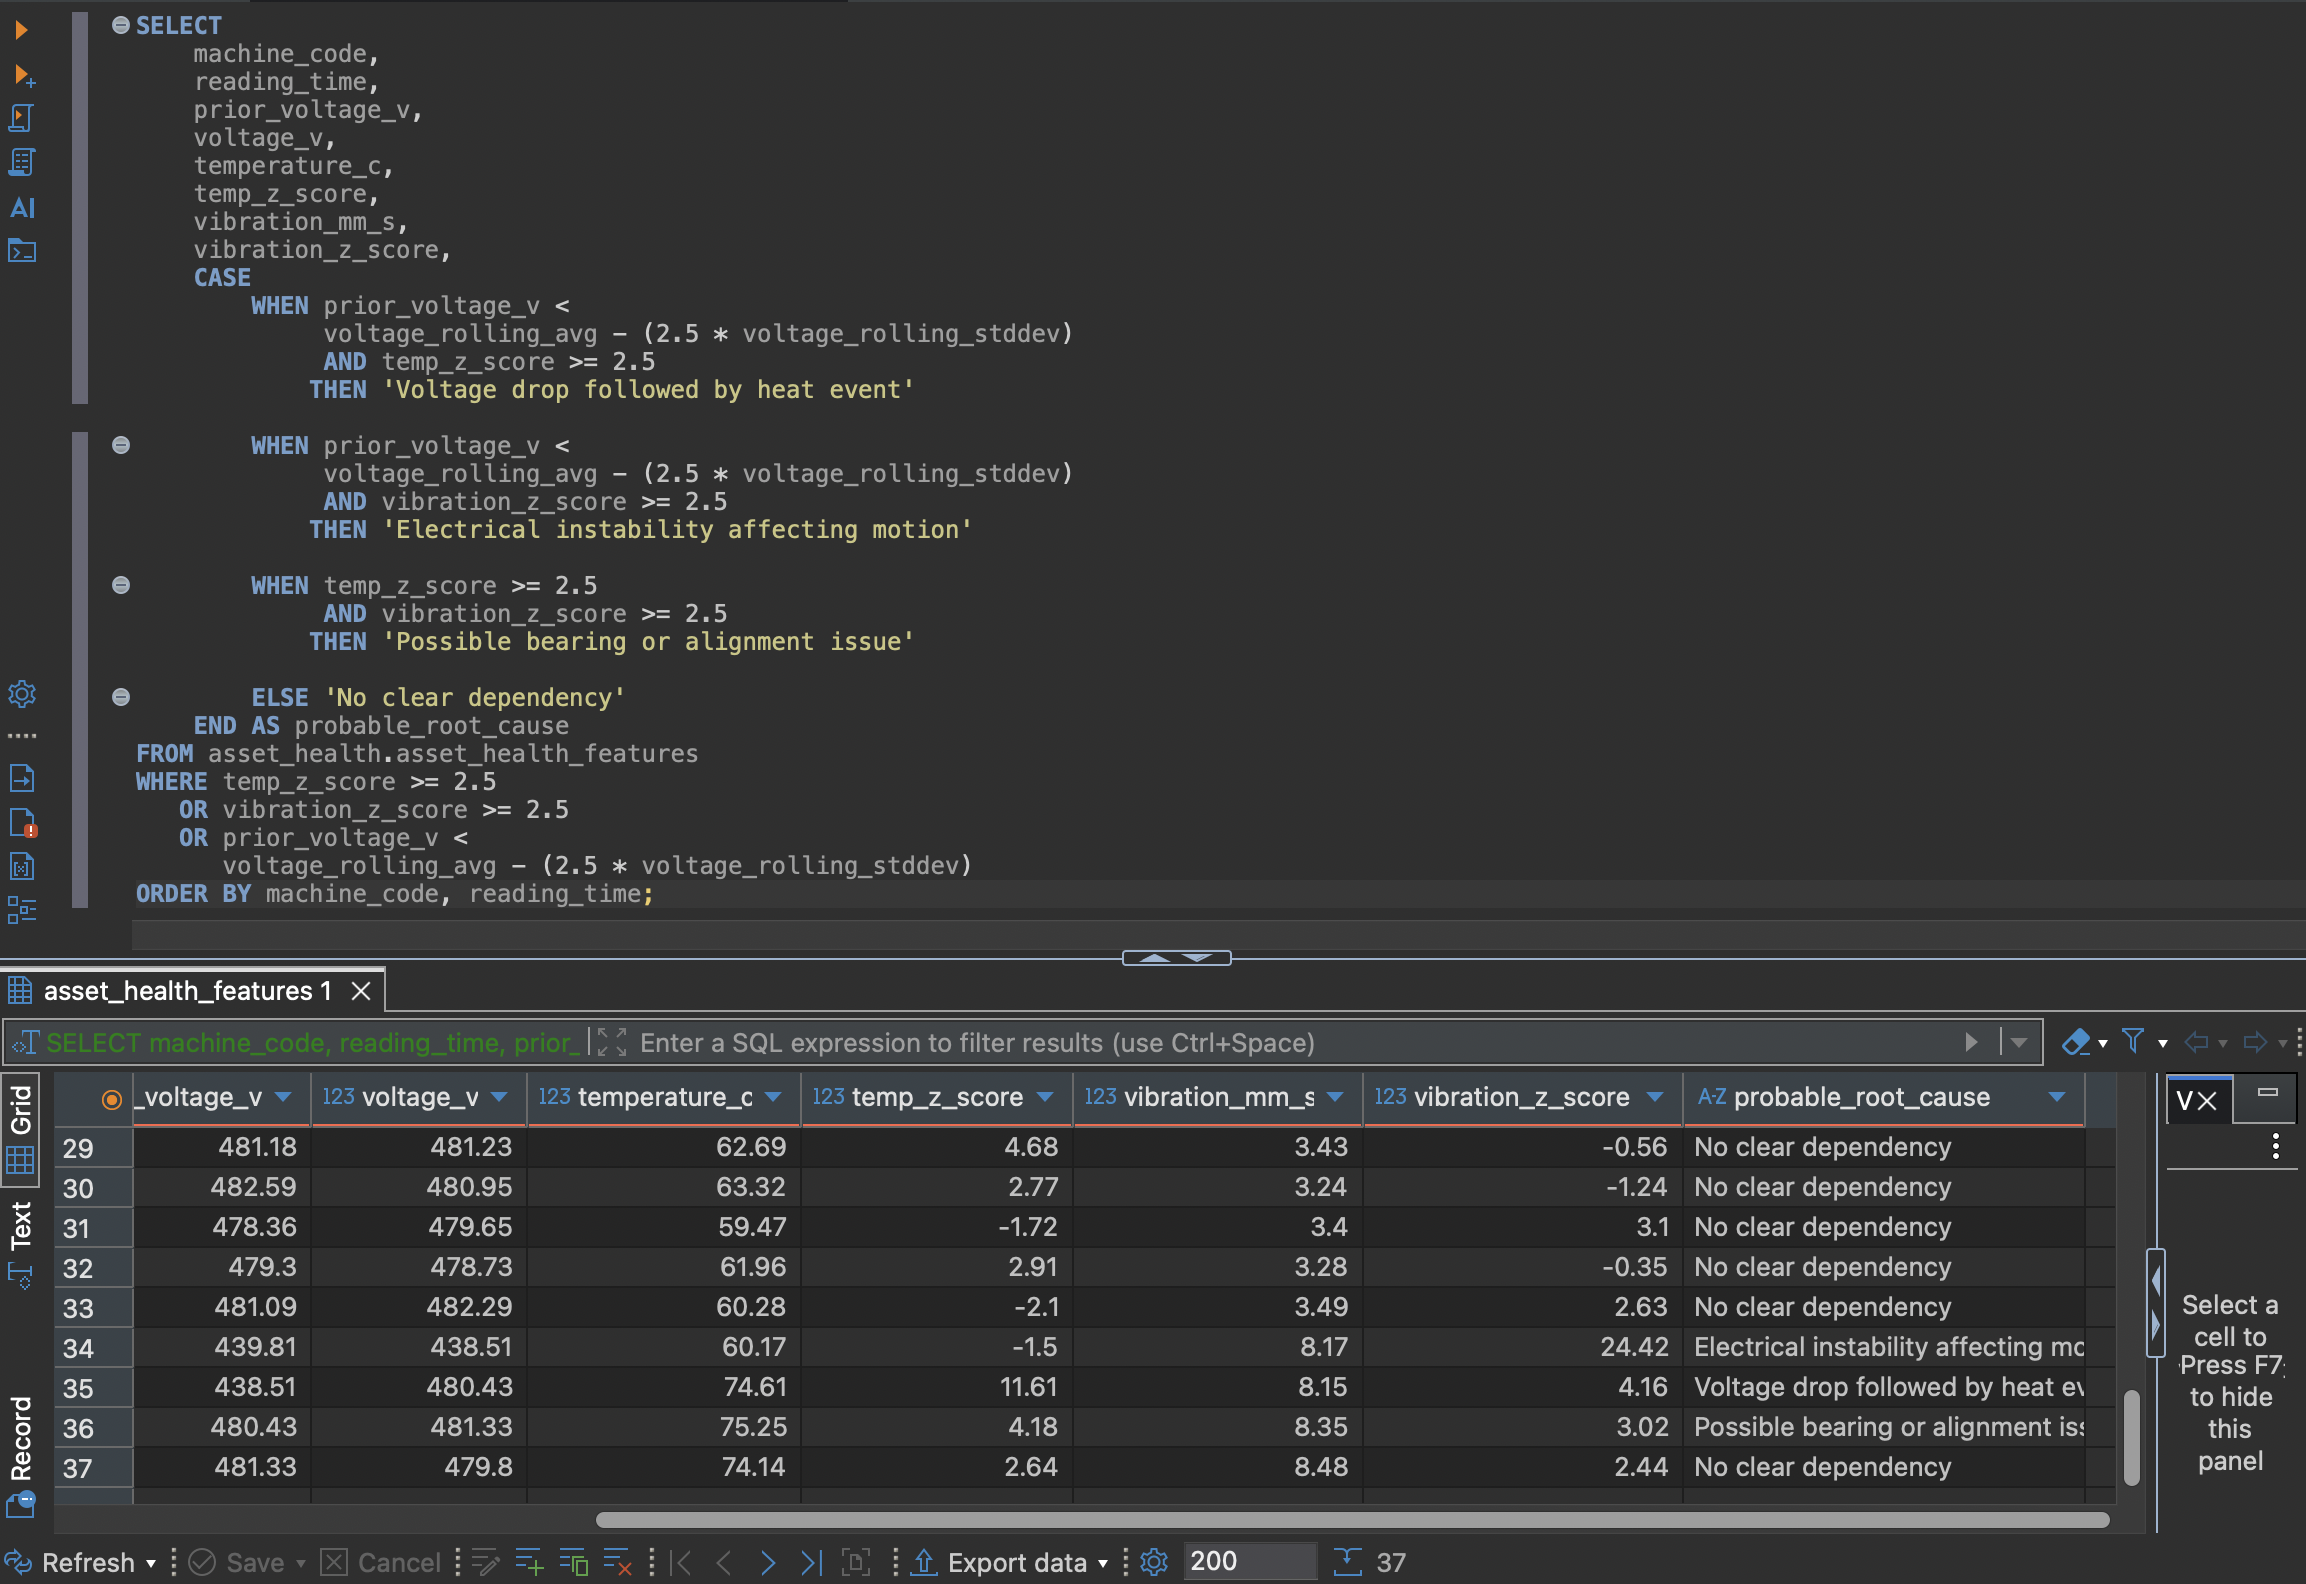
PostgreSQL LAG functions compare current events with prior voltage and mechanical readings to identify possible event chains such as a voltage drop followed by elevated heat or vibration.
RStudio Analysis
Equipment-health visualizations
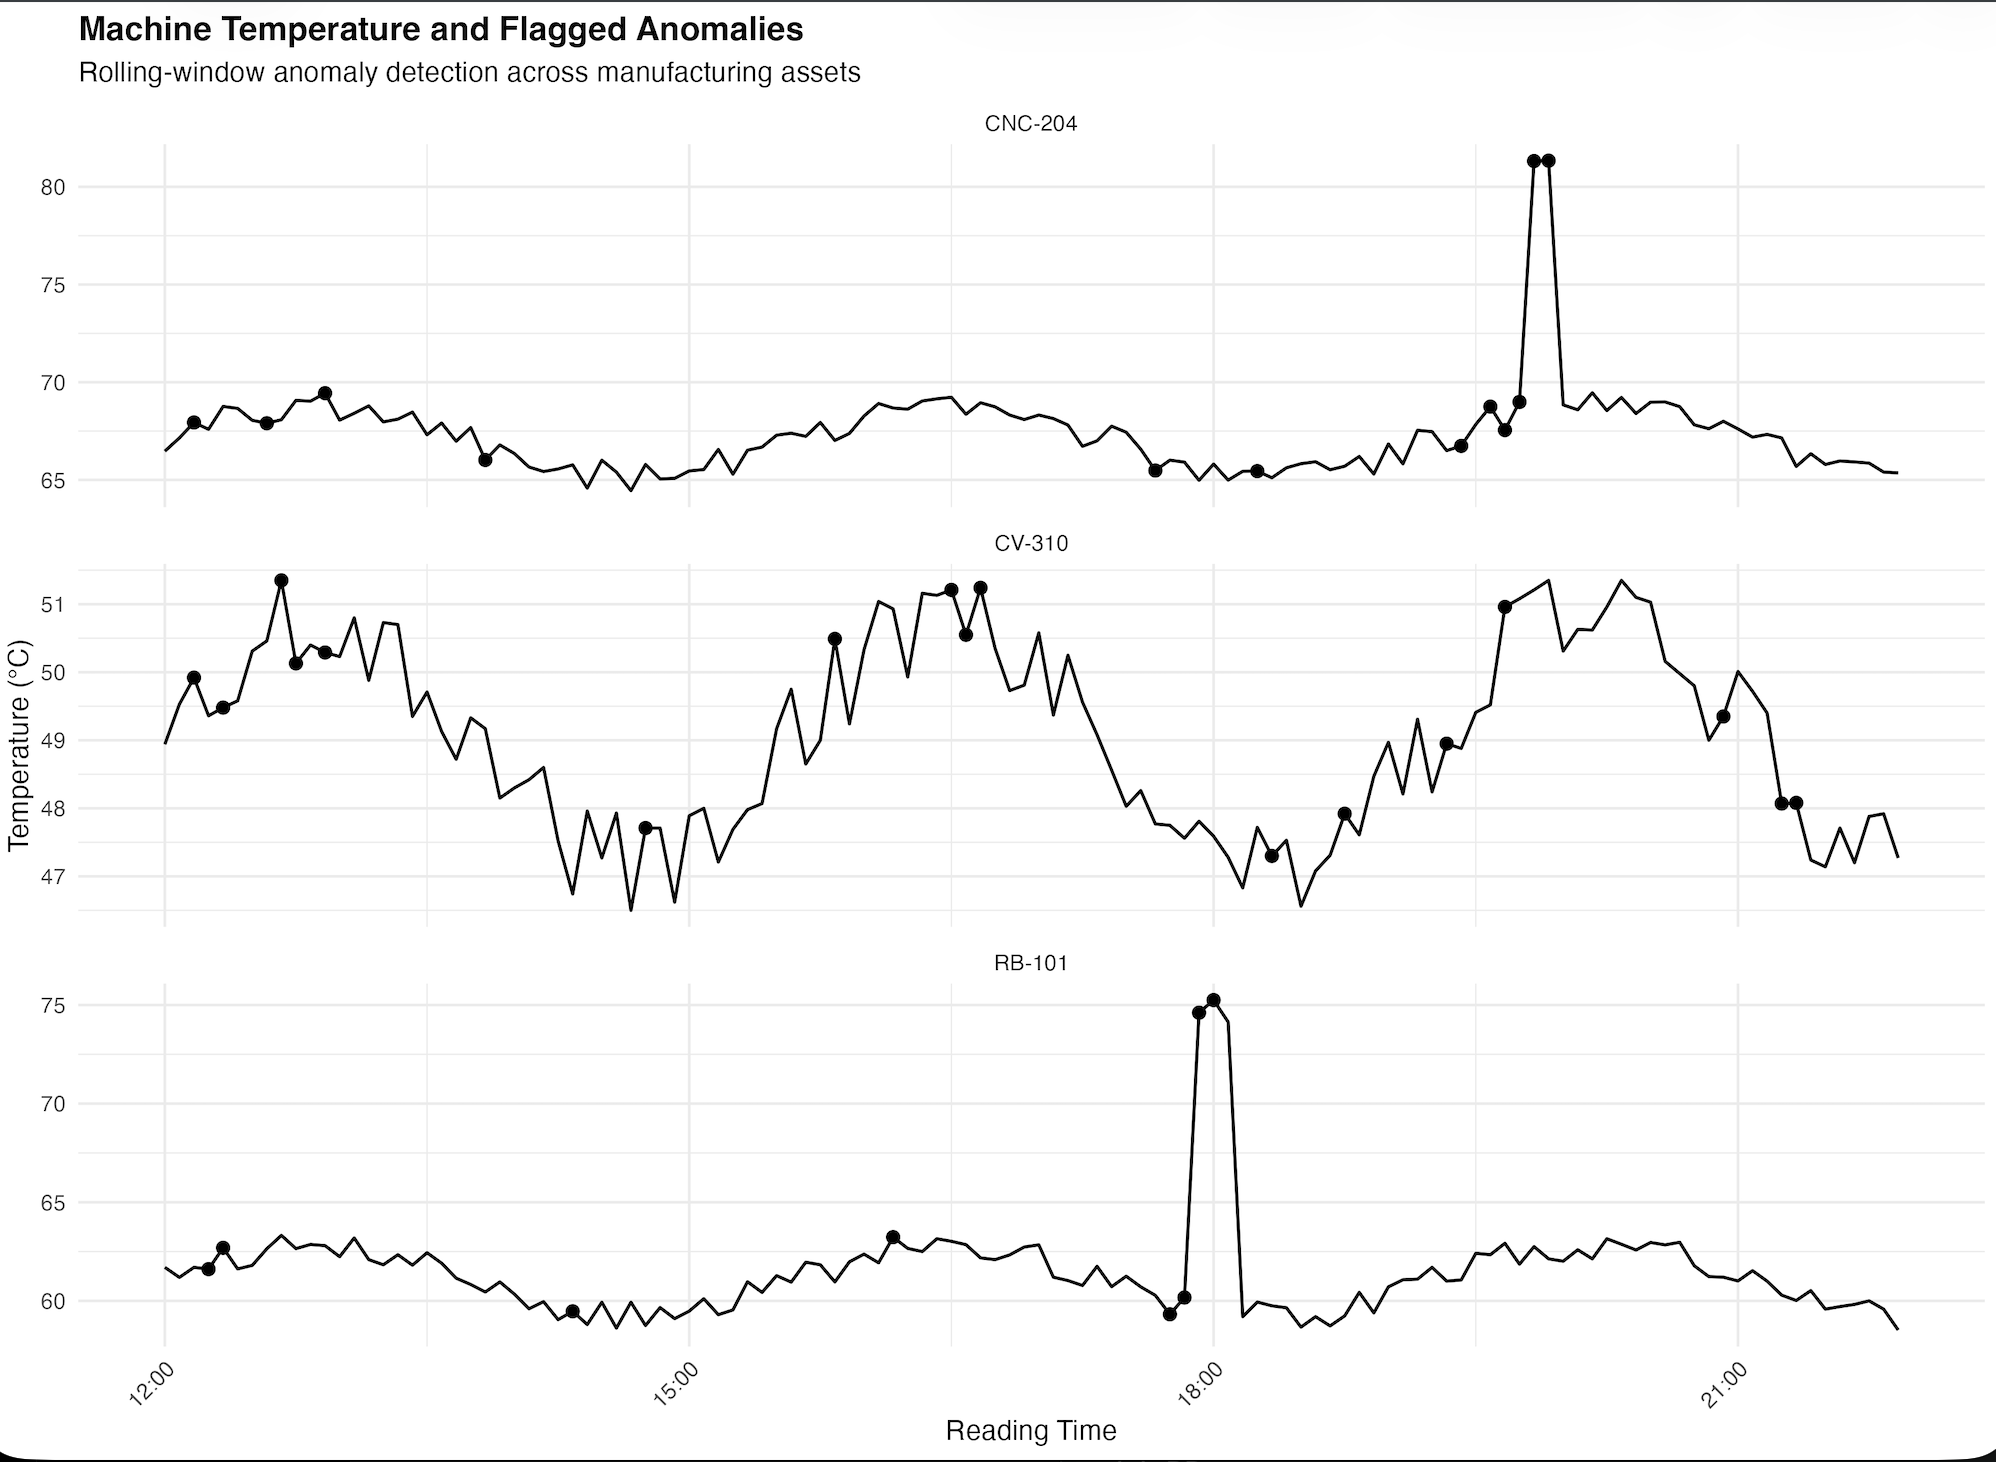
Temperature anomalies
Highlights abnormal heat patterns that may indicate mechanical friction, cooling issues, or equipment overload.
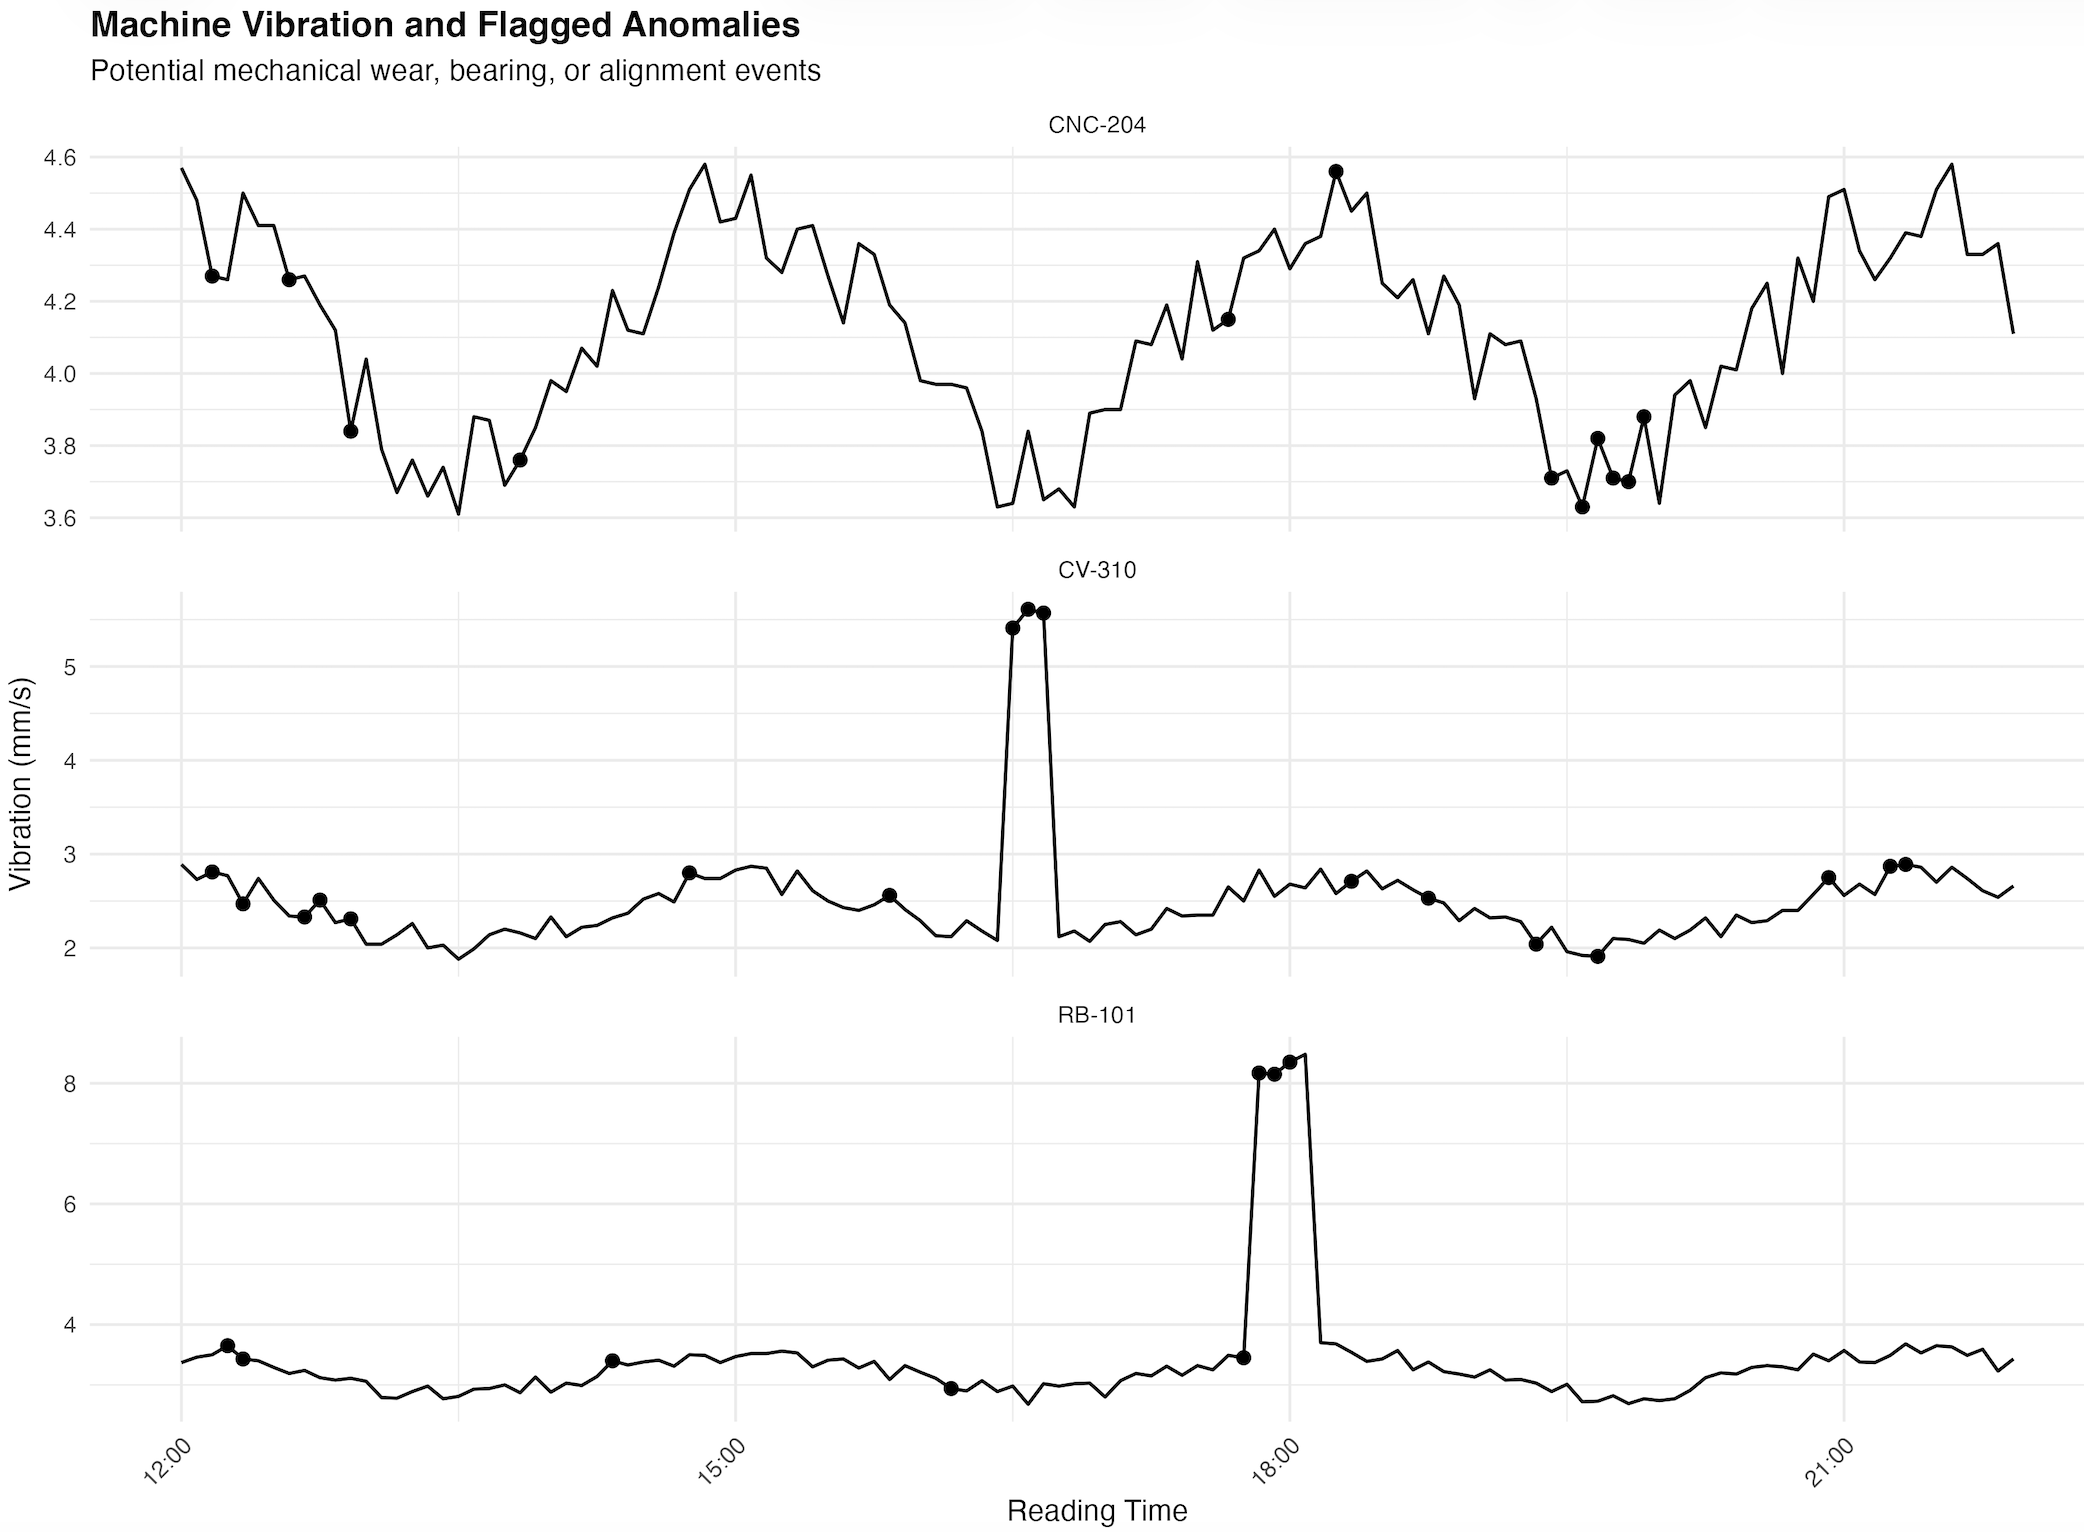
Vibration anomalies
Surfaces possible bearing wear, alignment problems, or unstable mechanical motion.
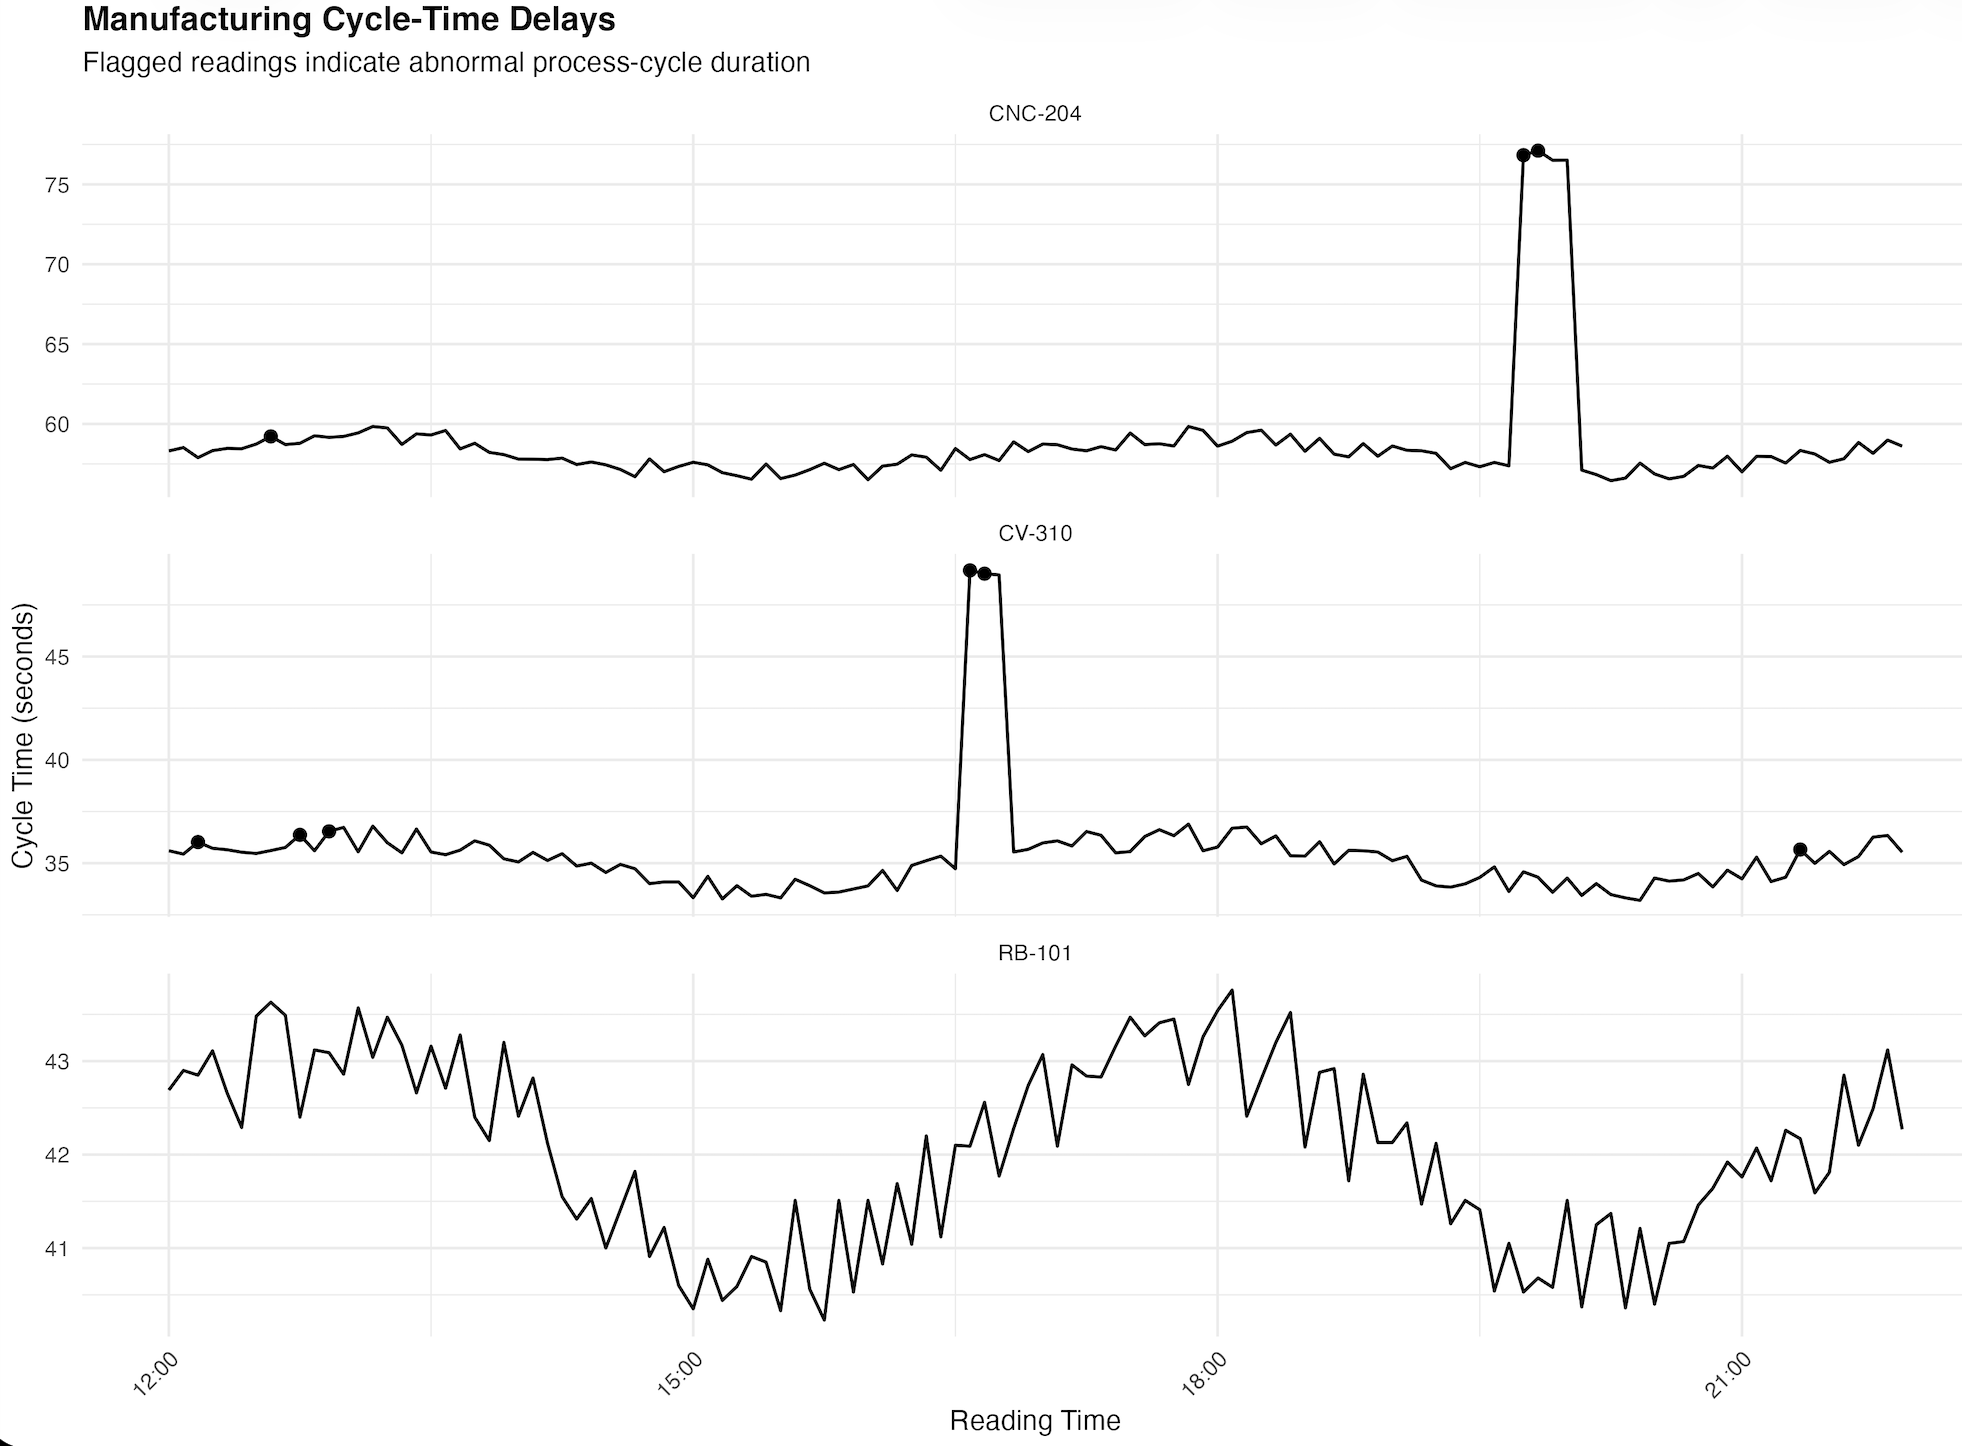
Cycle-time delays
Detects production delays that may indicate machine degradation, workflow constraints, or bottlenecks.
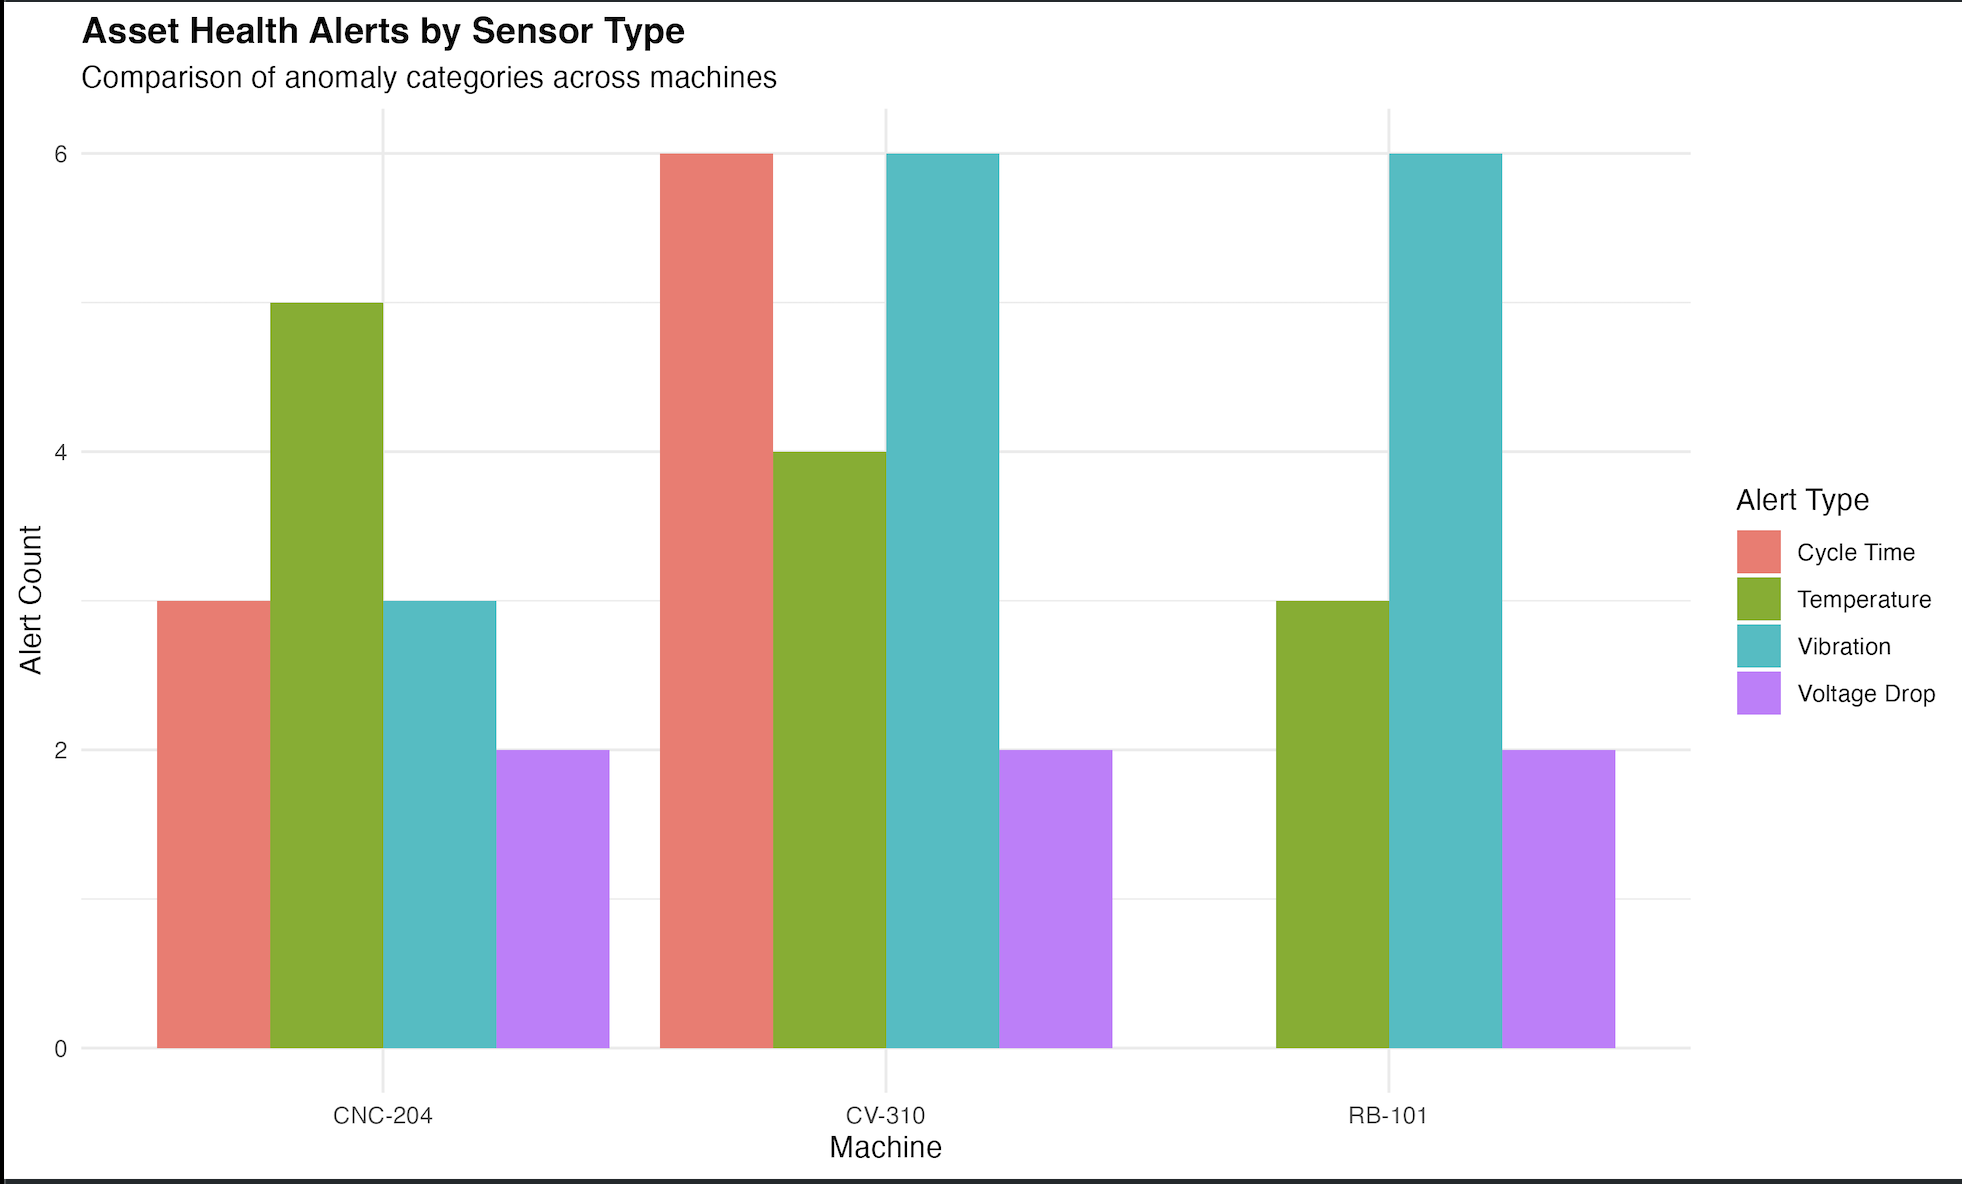
Alert comparison
Compares equipment-health alert categories across the monitored manufacturing assets.
Project Outcome
Predictive maintenance through SQL and R
This project demonstrates how manufacturing IoT data can be transformed into equipment-health indicators using PostgreSQL window functions, statistical anomaly thresholds, event sequencing, and R-based data visualization.
Explore the Repository